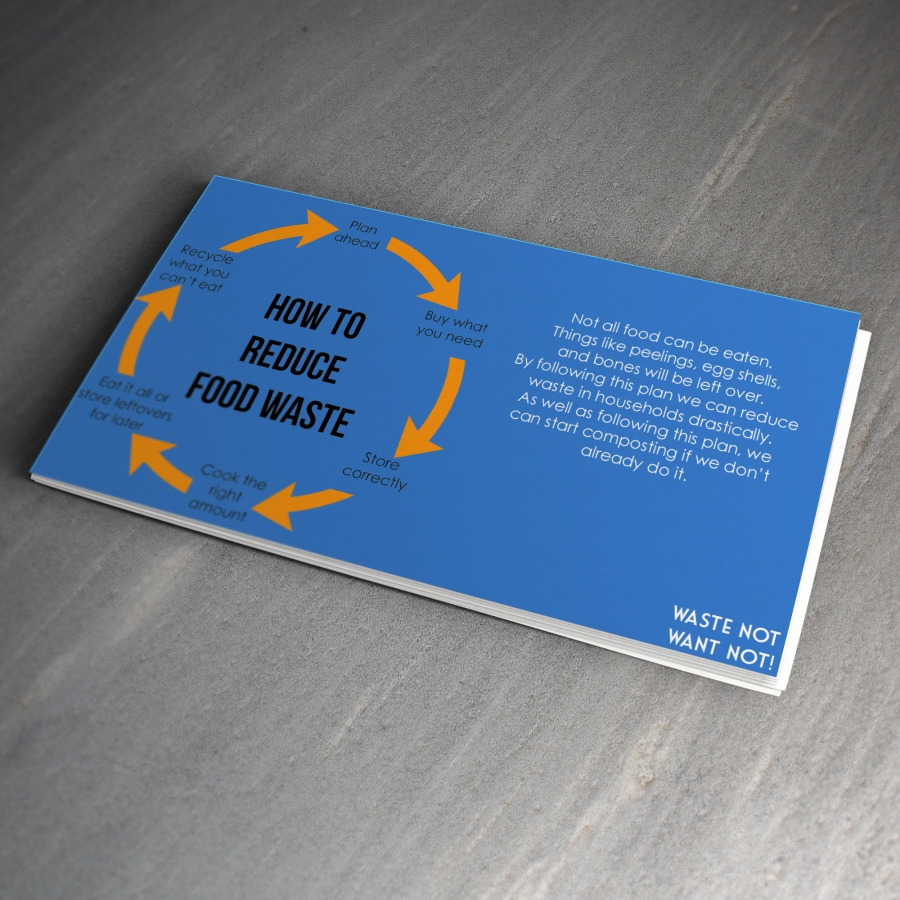
The assignment for this module was to create an infographic about food waste either aimed at households or businesses. I chose household and used a website called Love Food Hate Waste for some of the facts on the infographic. Here it is.

The assignment for this module was to create an infographic about food waste either aimed at households or businesses. I chose household and used a website called Love Food Hate Waste for some of the facts on the infographic. Here it is.

This infographic shows different TV stations employment of black and white male directors and black and white female directors, compared betwwen 2012-2013 and 2014-2015. Here are the figures for one of the networks:
ABC
2012-2013
Red 274 (71.5%)
Maroon 67 (17.5%)
Yellow 32 (8%)
Orange 10 (3%)
2014-2015
Red 299 (66.5%)
Maroon 83 (18.5%)
Yellow 49 (11%)
Orange 19 (4%)
Each figure shows how many shows are directed by that category of people (black or white male or female)
What is it trying to show?
The article is trying to say that it isn’t fair that long-running dramas such as Bones and NCIS aren’t hiring any women that are non-white but at the same time, 21 non-whitewomen were hired for Grey’s Anatomy.
What is it trying to say?
It is trying to say that American TV networks are not being racially fair, in the way that they employ/hire white males, a lot more than they would a non white female.
Is there a hook to it?
I think the hook to the infographic itself, not the article, is the colours of the pie charts. There is one big section and the rest are tiny, and people see it and think what is that big red section signifying.

I’ve wrecked my car – what do I do next
What would we ask about the question if we were to make it into an infographic?
Handbook for Student drivers
If it comes with insurance do we have to consider anything else?
The Science of Sleep
Infographic that appears on Buzzfeed / Facebook
Infographic for a documentary / National Geographic
17 facts about sleep that will blow your mind
The Internet of Things
(Genuine term – nowadays everything connects to the internet and people can communicate. Other items, not just computers. :Cars with Traffic Reports / DAB / GPS. :TVs :Hive :Record Sky from your phone :Philips light bulbs – can control from your phone)
Create an infographic to explain this
Sourcing Sustainable Fish
Does anyone think about where it comes from?


Having been set the task of creating an infographic about The Great British Bake Off. I created some thumbnails of how I would have liked it to look with the information that we could include. Some of these things could be:
Then we got feedback from our thumbnails for our bake off designs for an infographic. I didn’t like my designs that much but others appeared to compliment and help me explore what I could do with it, in terms of hierarchy and typeface choices. These are my thumbnail pages:


I started mapping out where the bakers were from using Google Maps and Wikipedia to tell me where they were from.

In illustrator I started mapping where the bakers lived with my own map icon and little white dots, which will appear in my infographic.
We went over what the class did in terms of using colours and types.
In terms of colours, the class used cake colours and pastel colours because when you think off Bake Off you think about cakes you think about light browns, creams, reds, and all sorts of colours similar to creams and sponge cakes.
In terms of typography, a lot of people used script fonts and used sans serif fonts. Some people used Bebas as a title font as well because it creates nice titles as it’s bold and stands out a lot.
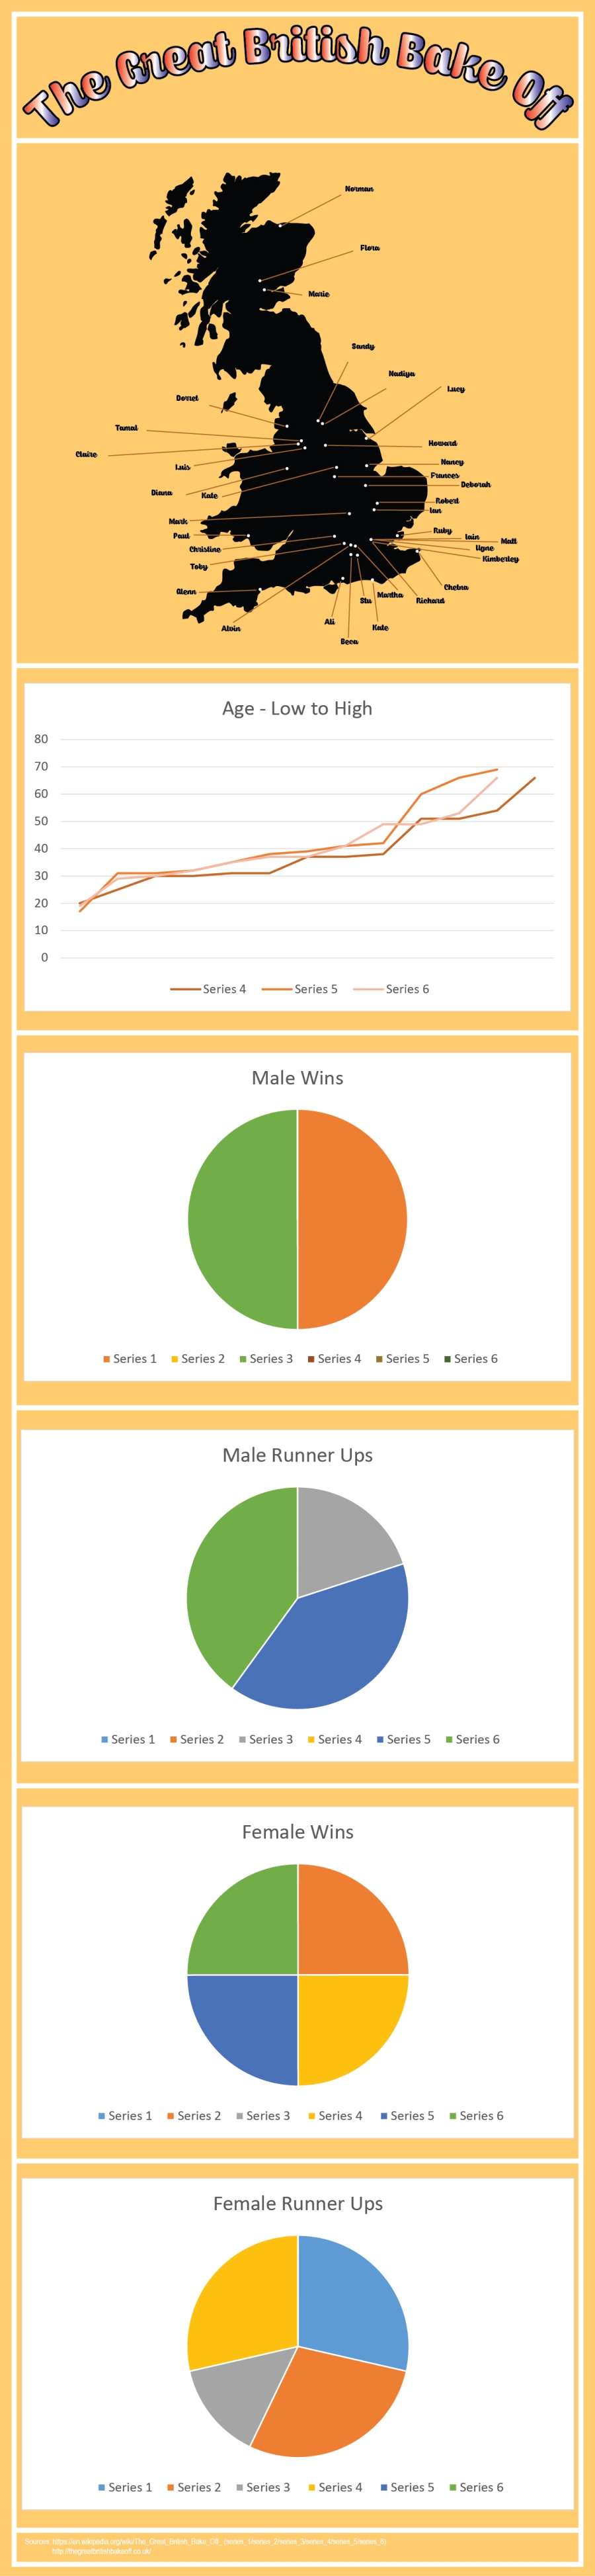
This is my Bake Off Infographic. I showed it to the class and got some feedback from them. The comments were:
Compared with other people’s infographics
Clare’s infographic was laid out like a recipe which made it relevant to Bake Off by following a recipe. If you follow a recipe you have immediate ingredients and then you have a part that says you will also need, which the added extras of her infographic was little extra bits of information that we wouldn’t expect.
Sandra’s infographic was based on a cycle. It had a better colour scheme than my infographic and some more iconic illustrations such as a bowl, spoon, bags of flour, etc. The fact that there are both illustrations that are fun and a formal graph makes it look like it has a mixed audience.

I changed the typeface of the names of the bakers and colour coded the lines for which series the bakers were in.
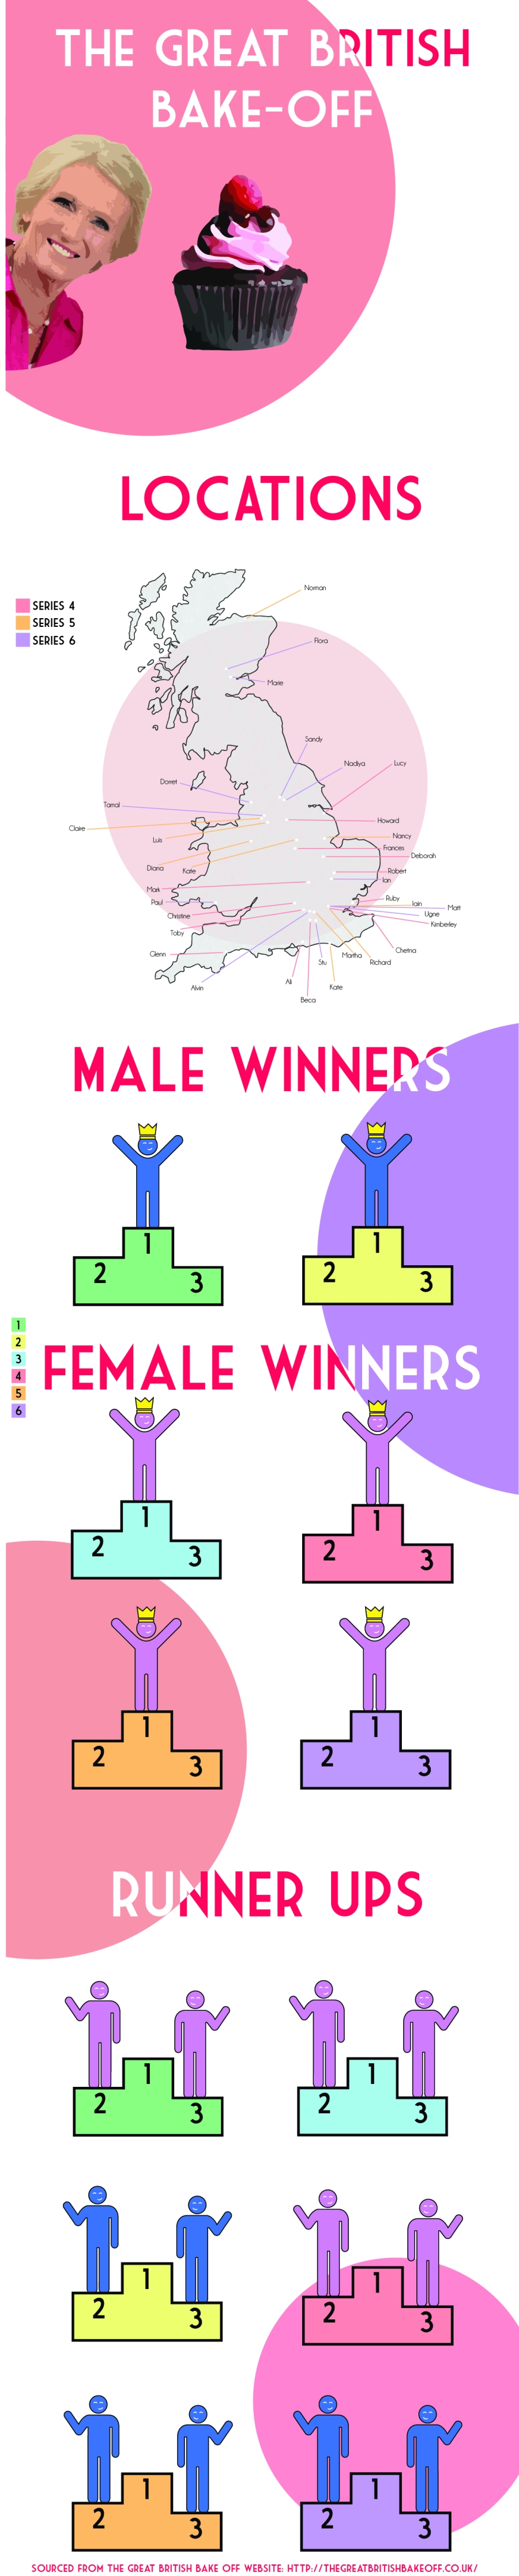
This is my new and improved bake-off infographic.
For this task we were asked to create an infographic using the data.gov website to get our data. I chose the Department for Culture, Media, and Sport and what they spent on publicity one month compared with a different year. This is what it looks like:

As a class we were identifying the strengths and weaknesses of each others infographic, and my improvements were to change the background colour to something a little lighter, and instead of using the CMYK black, use the hex code 000000 for black as it makes the text a little easier to see. This is the result:

Where would you see certain infographics? Ideally you would see infographics with the intention of getting children’s attention, in a school. A school is a good place to put infographics to get children’s attention on things around the school and about life itself. Even if it’s about how to hold a pencil correctly to do good handwriting, it would still be located in the school. An infographic on how to give CPR however, would not be in a school directed at 7 year olds because they shouldn’t have to do anything like that until they get much older. An infographic about how to give CPR would most likely be found in a hospital or in a first aid book, where adults can access it in case of emergencies.
An information graphic is a visual representation of a data set or instructive material. Each infographic has a different audience. If you google search “childrens infographics” it comes up with this kind of imagery:

There are lots of bright colours and images that children will find easy to understand and recognise. For example:

This infographic is about how well certain underwater mammals can swim and they compare it to the amount of time that we as humans would have to hold our breath underwater which shows the children that they are “super swimmers” as the title says.
When you search for “adult infographics” on google, it comes up with things like this:

They still look very image based but they have a bit more data on compared to the children’s infographics. If a child is looking at an infographic about the statistics between different social media sites, they will look very blankly at it and it will not engage them, however for an adult, such as myself, I might look at an infographic about different social media sites and say “oh my god I didn’t know that” which is what an infographic is supposed to do.
This is the data.gov.uk website which gives you informational structure within different parts of the government.

Clicking on the Organogram – which is an organised diagram – you can pick a category and the position and it will tell you about the position of the person you have chosen.